Miami, Orlando, and Tampa Bay. One strategic standard.
Q3 2026 industrial market intelligence across South Florida, Central Florida, and Tampa Bay. Latest published reports verified October 18, 2026.

Miami
South Florida remains a global capital destination supported by international investment, population growth, trade, finance, professional services, hospitality, and cross-border business activity.
- Industrial vacancy
- 7.2%
- Industrial asking rent
- $17.08 PSF
- Net absorption
- +1.41M SF
- Direct vacancy
- 6.4%
Q3 2026 overall vacancy, including sublease
Q3 2026; NNN asking rent
Q3 2026; strongest quarter since Q1 2023
Q3 2026; excludes sublease vacancy
Source: Avison Young — Miami Industrial Market Report, Q3 2026.
Q3 2026 report; verified October 18, 2026.
- International capital
- Trade and logistics
- Port and airport access
- Finance and professional services
- Population and migration
- Retail demand
- Industrial constraints
- High-value land
- Cross-border investment
- Insurance & operating costs

Orlando
Orlando and Central Florida continue to attract population, employers, logistics operations, healthcare investment, tourism-related businesses, and expanding professional services.
- Industrial vacancy
- 10.6%
- Industrial asking rent
- $10.48 PSF
- Net absorption
- +25,000 SF
- Under construction
- 3.29M SF
Q3 2026; unchanged quarter over quarter
Q3 2026; rent basis not specified in source summary
Q3 2026 quarterly total
Q3 2026; across 29 properties
Source: CBRE — Orlando Industrial Figures, Q3 2026.
Published October 7, 2026.
- Population growth
- Employment
- Transportation
- Logistics
- Healthcare
- Tourism
- Business expansion
- New development
- Commercial corridors
- Industrial demand
- Retail growth
- Infrastructure
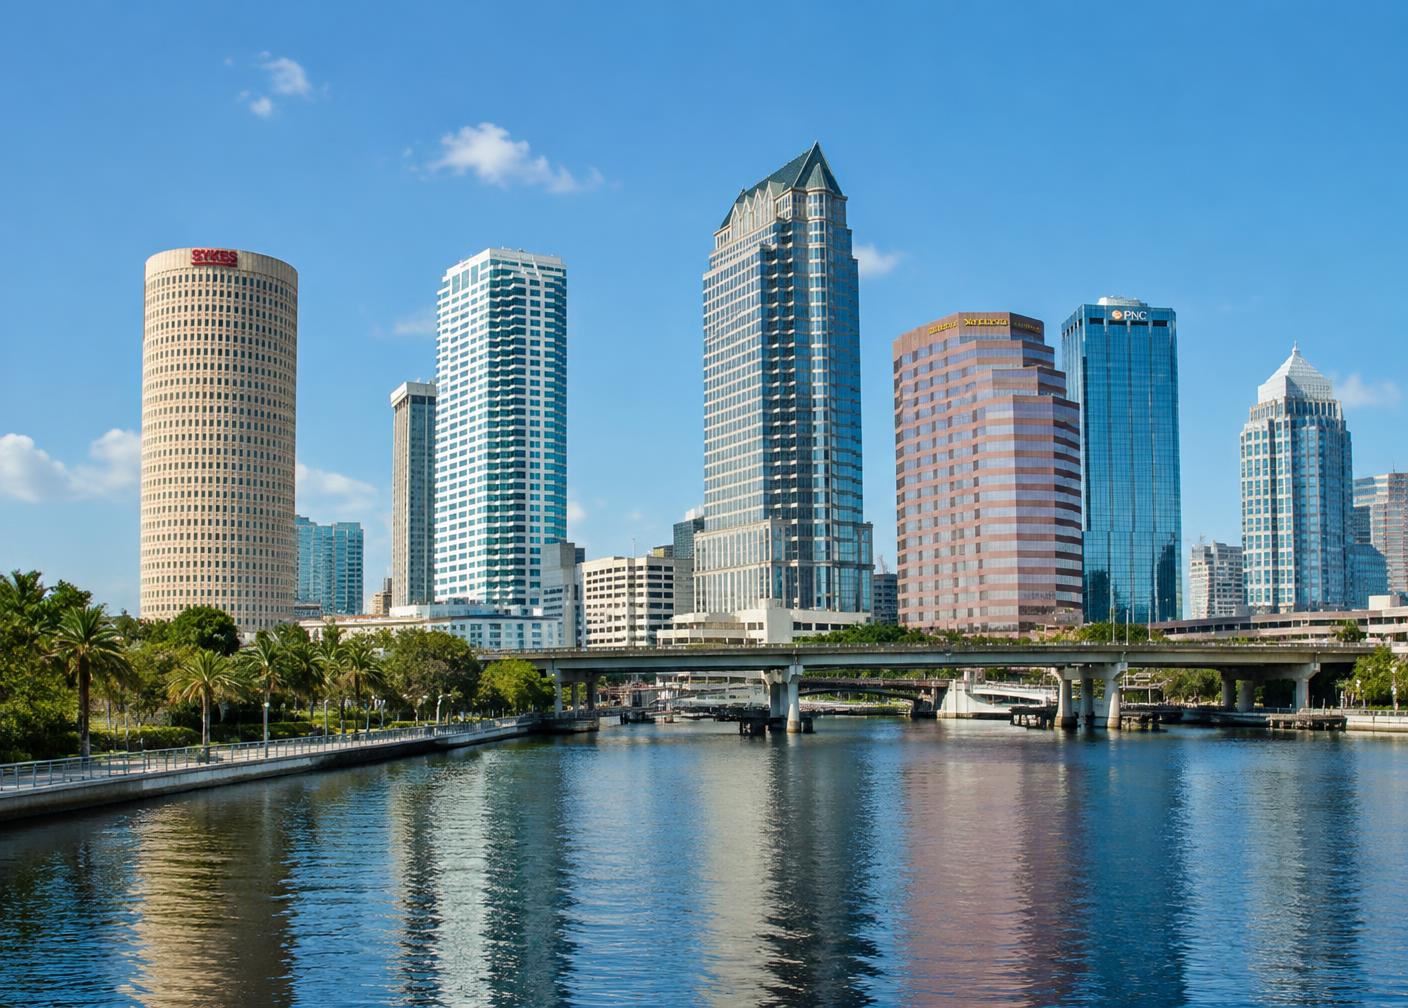
Tampa Bay
Tampa Bay's industrial market offers more options for large occupiers as new supply and returning large blocks lift vacancy. East Tampa remains a focal point for development, while year-to-date absorption remains positive.
- Net absorption — YTD
- ≈+850K SF
- Quarterly absorption
- Slightly negative
- Vacancy trend
- Highest since 2014
- Asking rent trend
- Rising
Through Q3 2026; nearly 850,000 SF
Q3 2026; exact total not published in summary
Q3 2026; exact rate not published in summary
Q3 2026; led by premium first-generation space
Source: CBRE — Tampa Industrial Figures, Q3 2026.
Published October 9, 2026.
- Industrial supply
- Large-block availability
- Port access
- I-4 logistics corridor
- Healthcare
- Professional services
- Owner-user opportunities
- New development
Figures reflect Q3 2026 industrial research from Avison Young (Miami) and CBRE (Orlando and Tampa), verified October 18, 2026. Brokerage coverage and definitions differ; these figures are not a like-for-like ranking of markets. PSF means per square foot; NNN excludes taxes, insurance, and maintenance. Tampa's published summary provides trends rather than exact vacancy and rent figures. Quarterly absorption and year-to-date absorption are labeled separately. Market conditions change. Property-specific decisions should be based on current data, active inventory, comparable transactions, zoning, and due diligence.